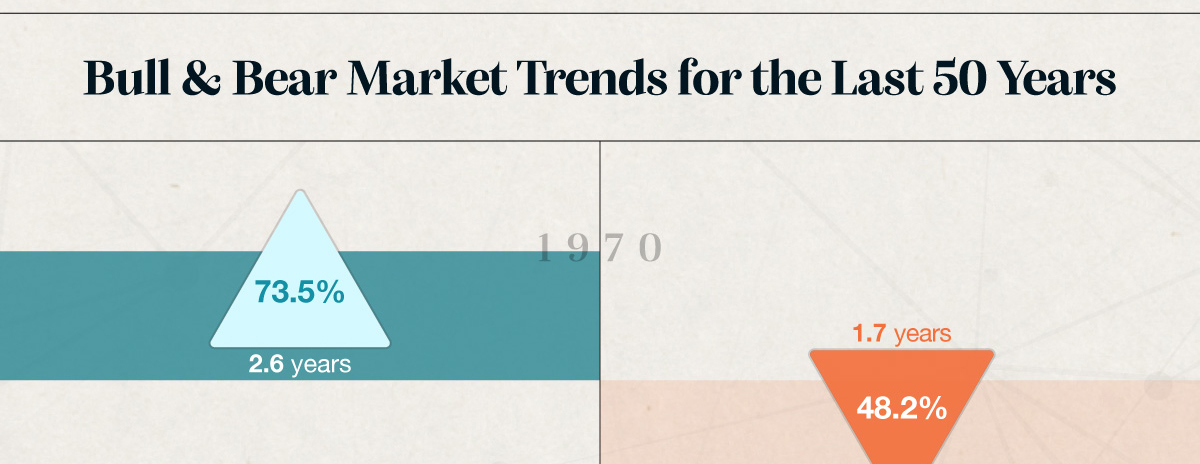
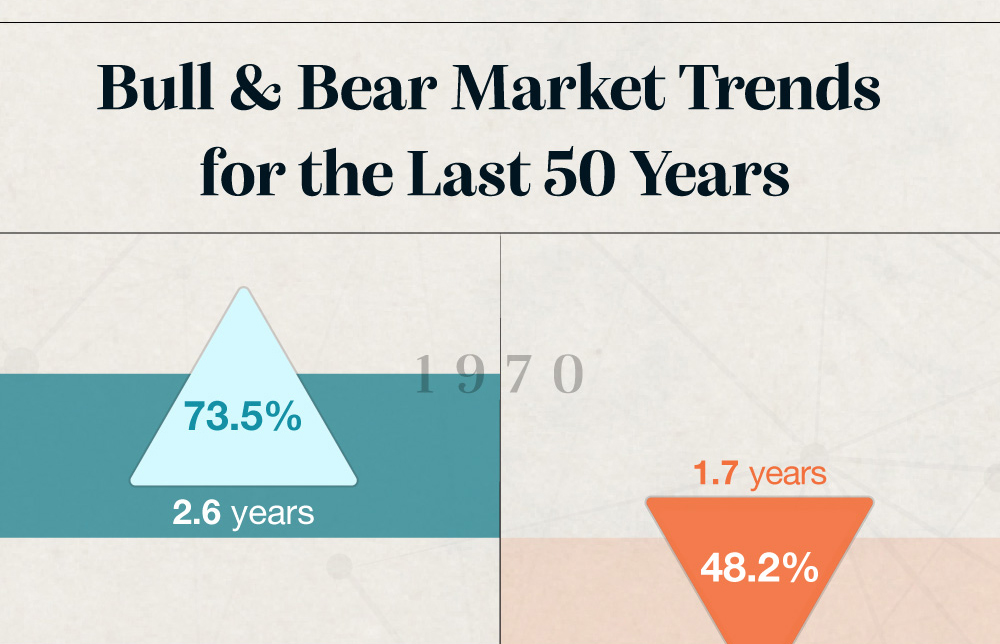
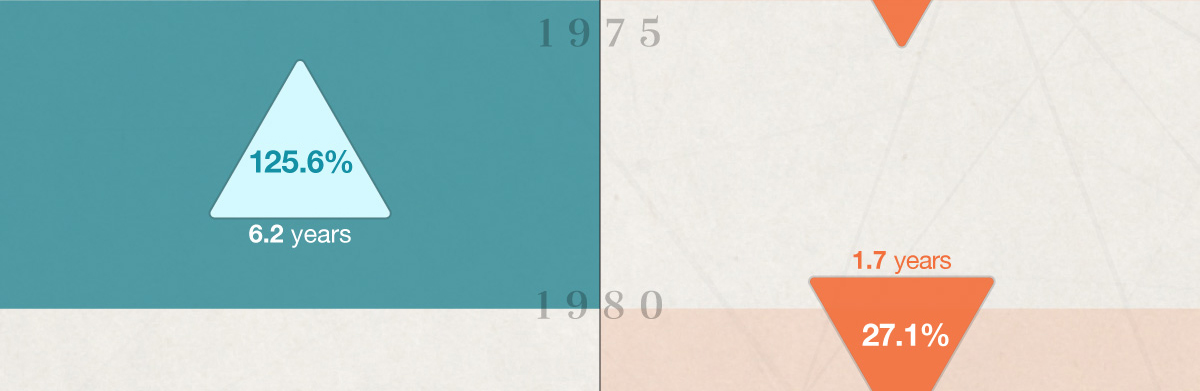
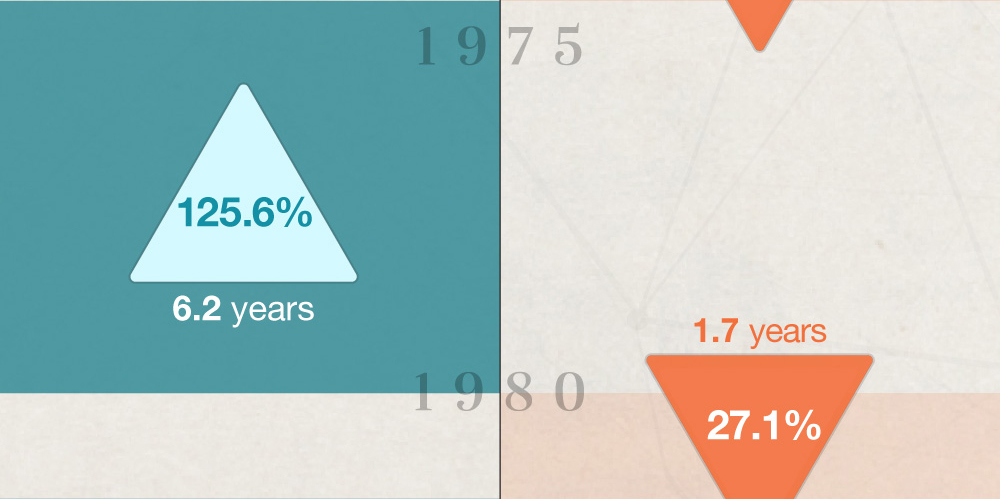
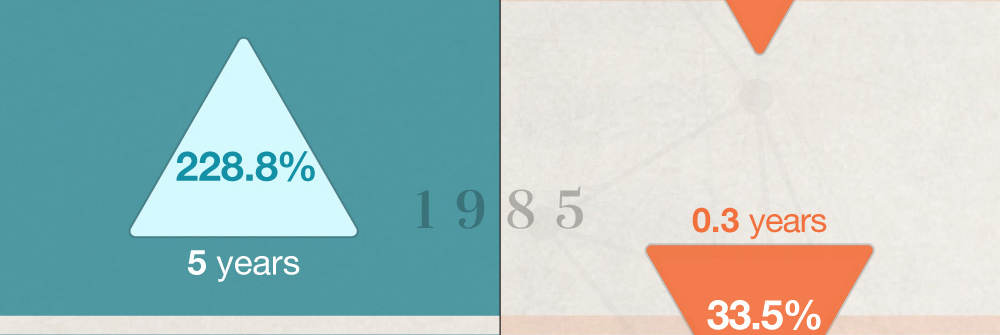
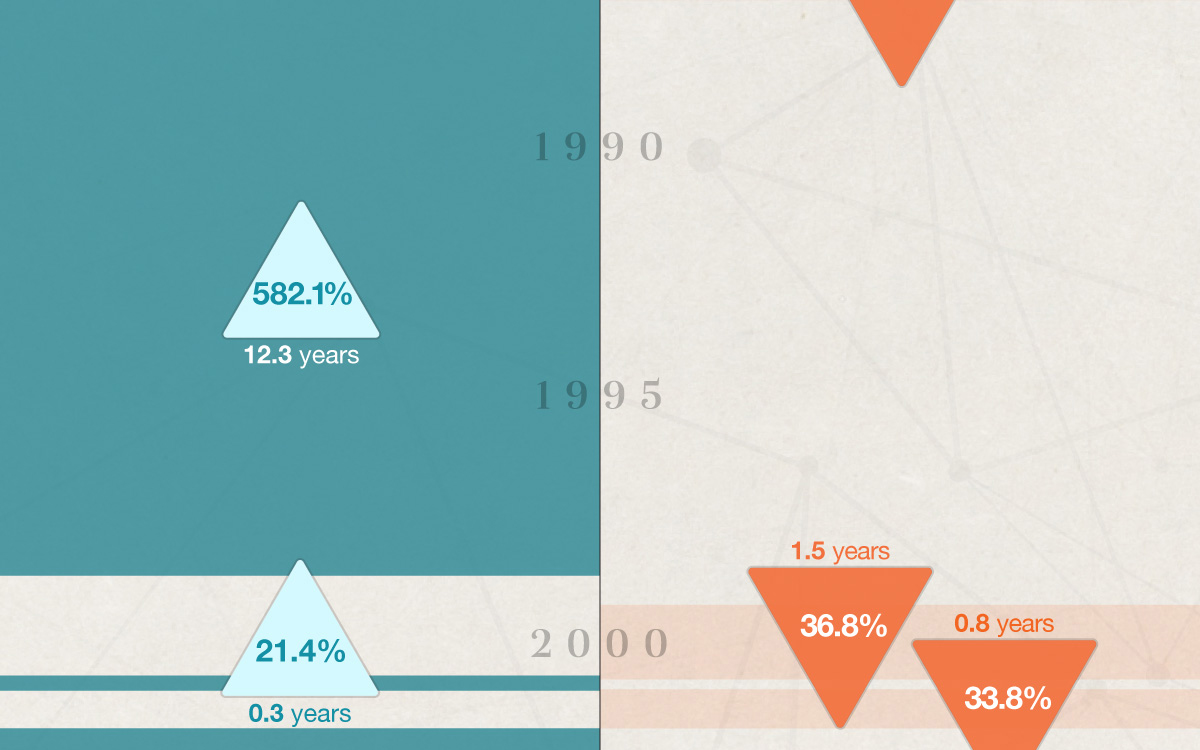
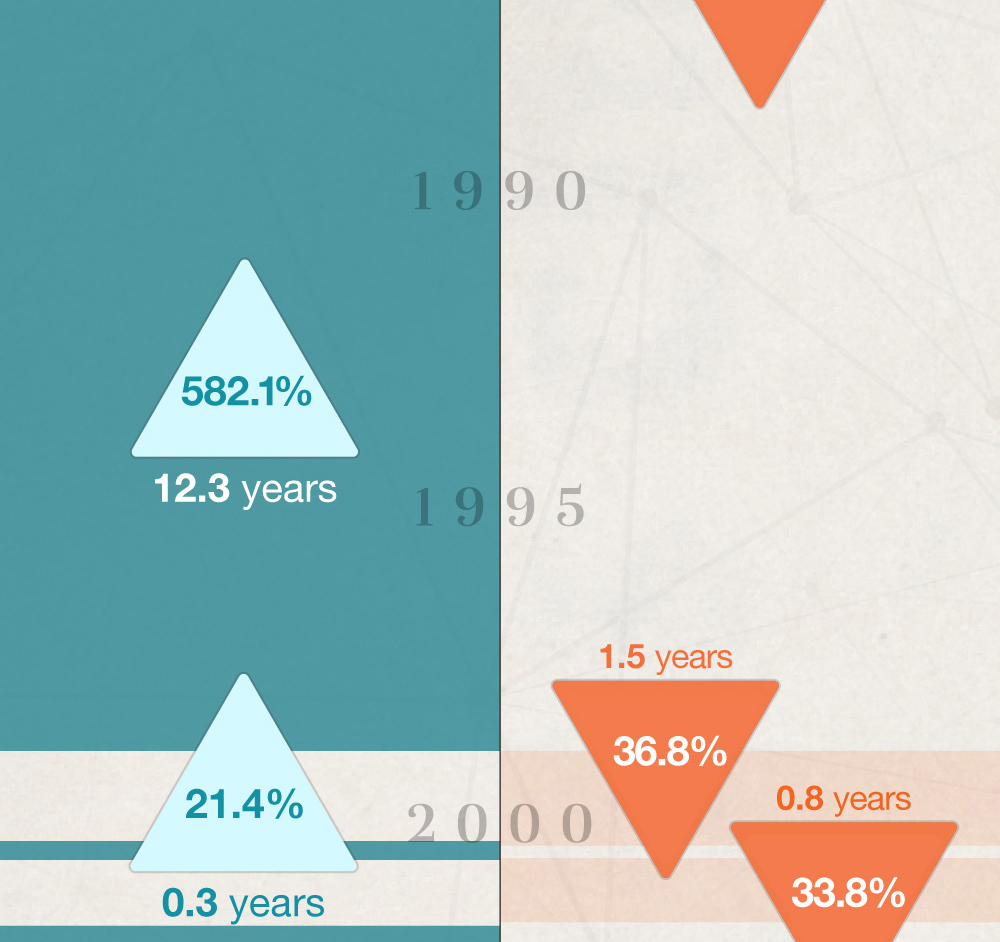
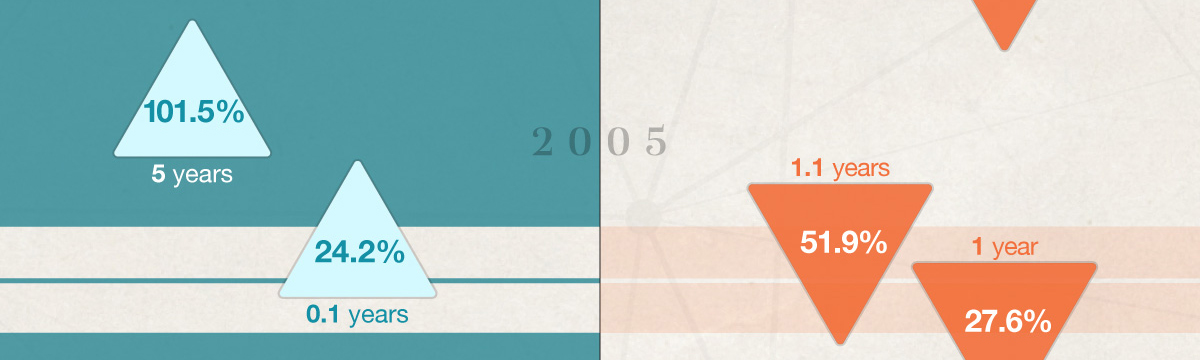
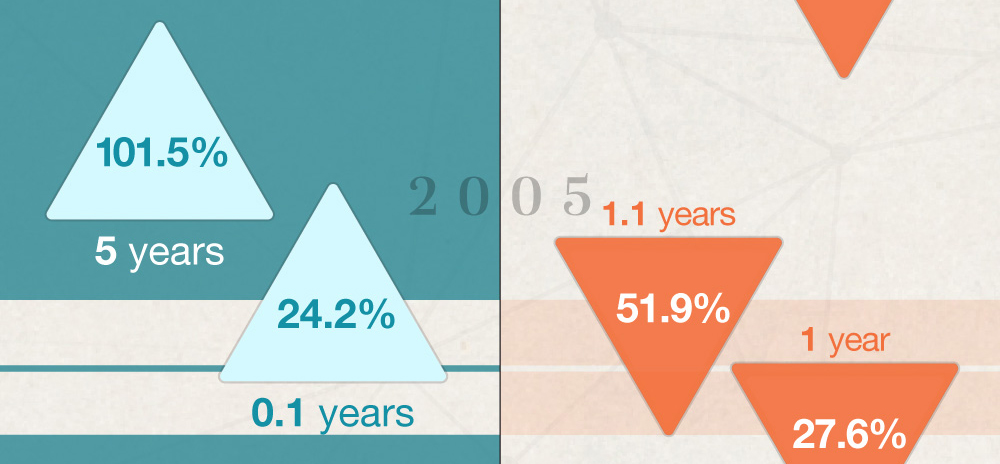
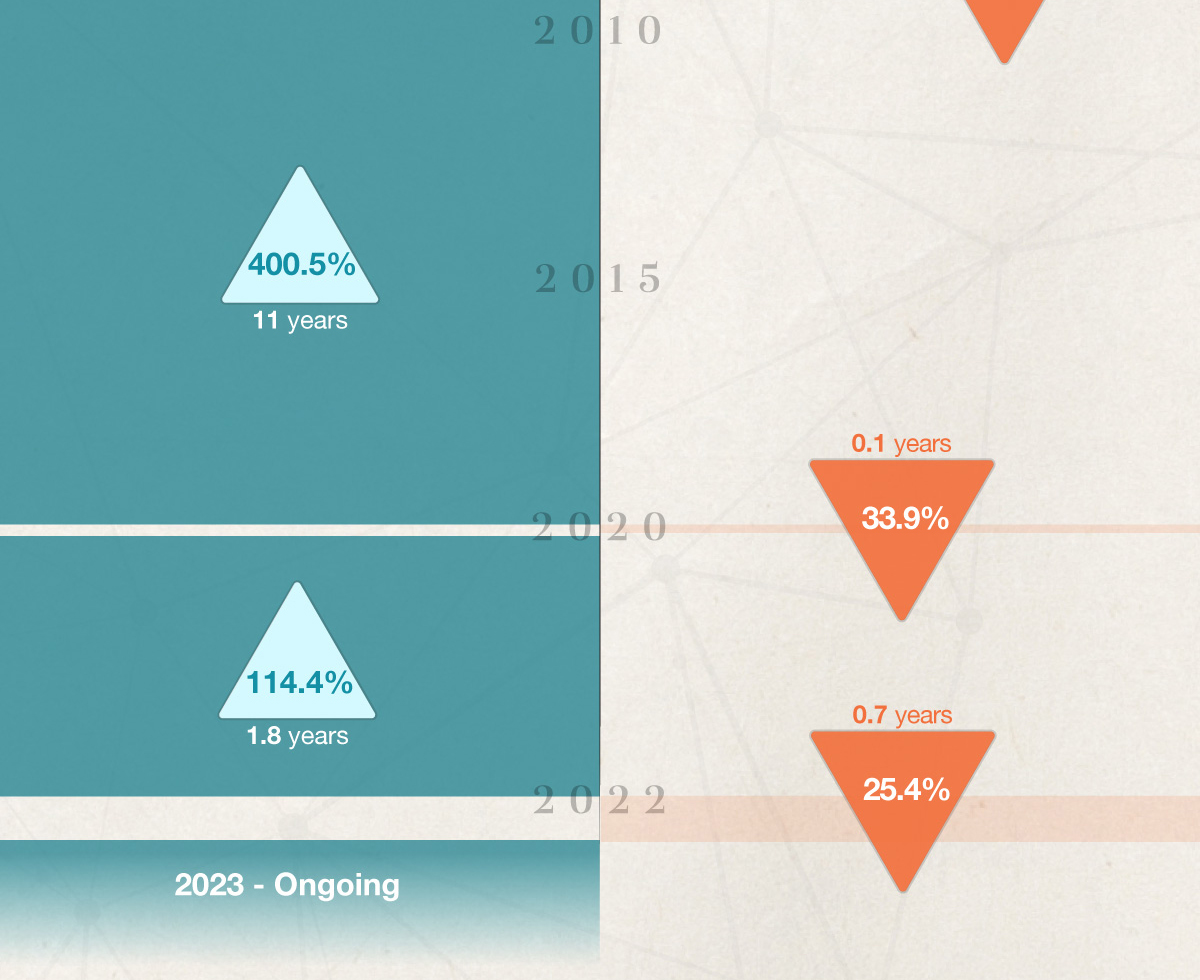
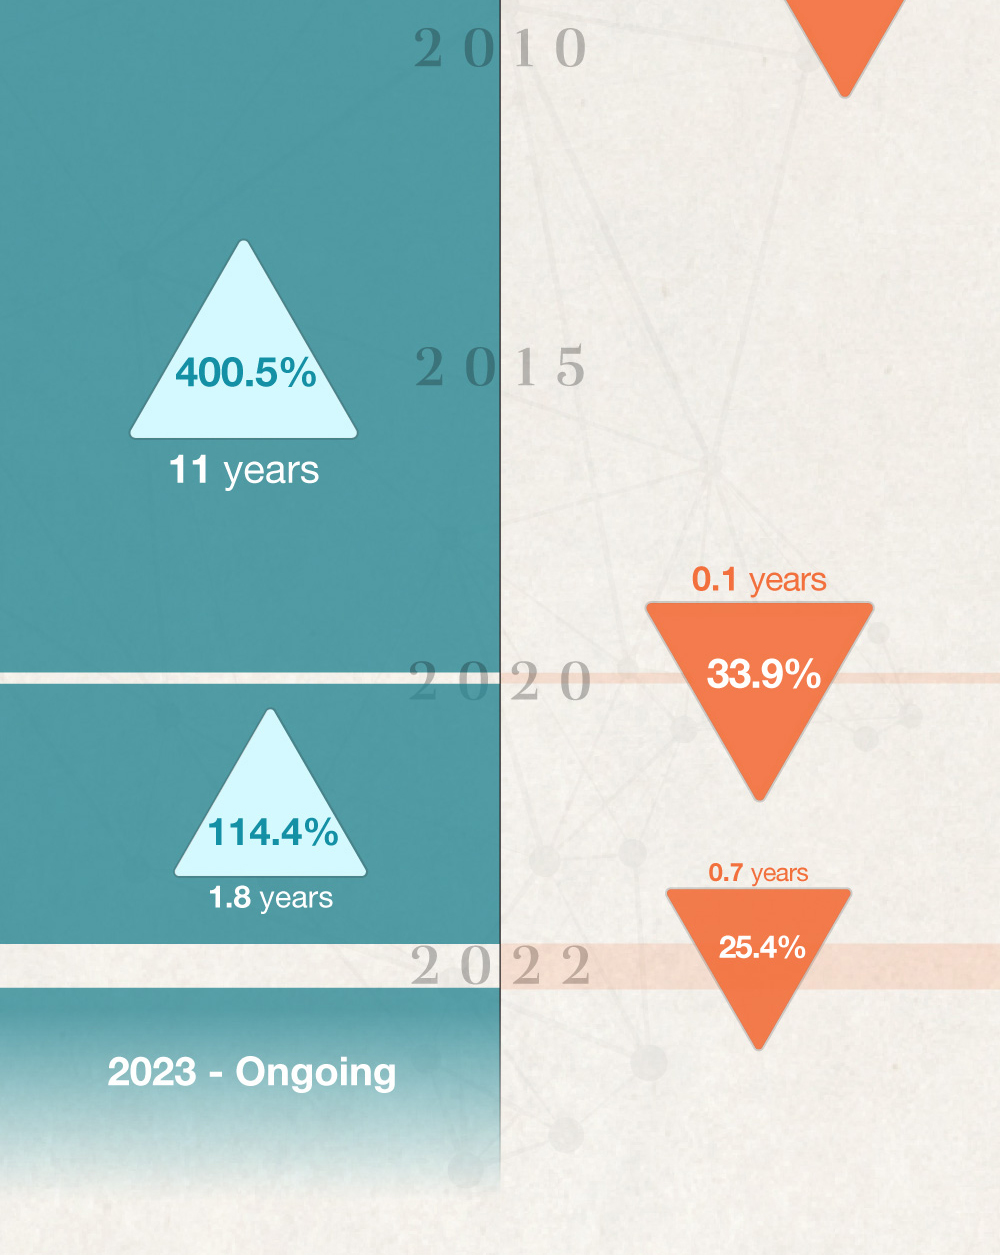
Bull & Bear Markets: A Timeline


A windfall from a loved one can be both rewarding and complicated.
What does it take to be an accredited investor? Explore the details, & the types of investments offered to those who qualify.
Building wealth requires protection from the forces of wealth destruction.
Retirement choices can feel intimidating. Choosing the right strategy can make all the difference.
How HSAs and FSAs might help your household.
It's important to understand the pros and cons when considering a prepaid debit card.
Weigh the potential outcomes of paying off debt versus directing those dollars elsewhere.
Estimate your potential federal capital gains tax liability on the sale of an asset.
Find out how large your emergency fund should be based on your monthly expenses.
Taking your Social Security benefits at the right time may help maximize your benefit.
What are your options for investing in emerging markets?
Here is a quick history of the Federal Reserve and an overview of what it does.